NASA Goddard recently produced this incredible visualization which tracks dust, smoke, and aerosols over the past year. The smoke from the high 2017 fire season in western North America is impressive. Less subtle are the small pulses of smoke from small fires in the southeastern U.S.
Incredible Visualization of dust, smoke, and aerosols by NASA Goddard
A break from research
Me and my boys were able to plan a quick escape to one of our favorite places to vacation. Hoping for some fresh snow and (relatively) light crowds for a few days of mid-week skiing at Whistler-Blackcomb. This is our first time staying in the Village in the Winter...
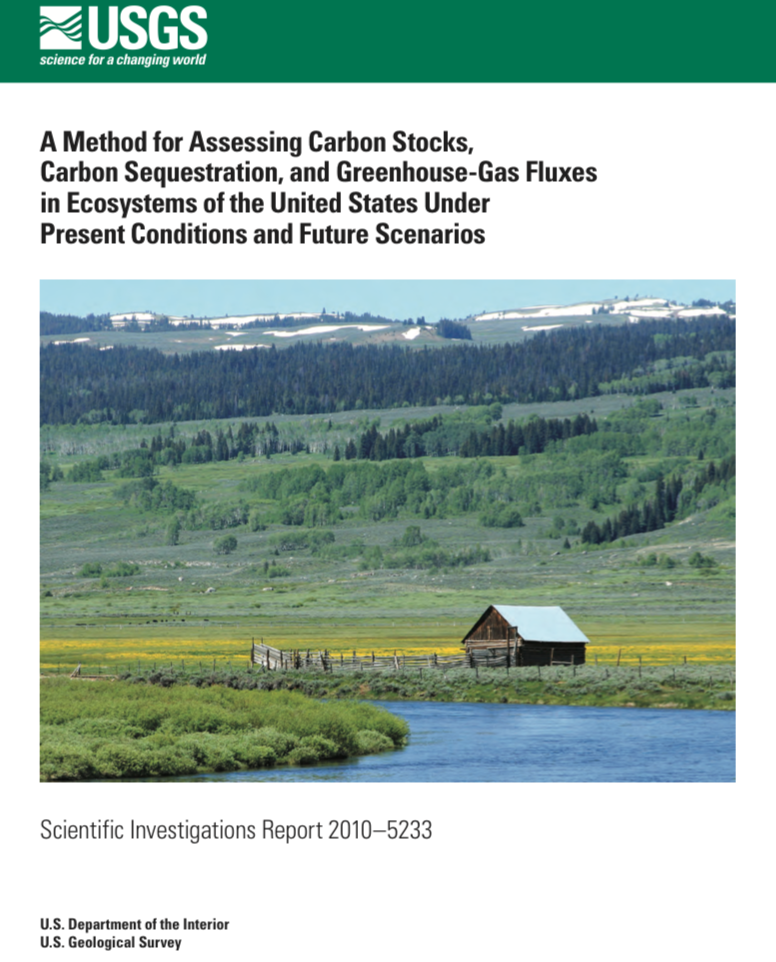
USGS Land Carbon Assessment Reports
The USGS LandCarbon project conducted a systematic assessment of carbon stocks and fluxes in ecosystems of the United States and current conditions and future scenarios. As part of the effort, the authors released a series of reports documenting their findings. The reports are organized by region and can be...
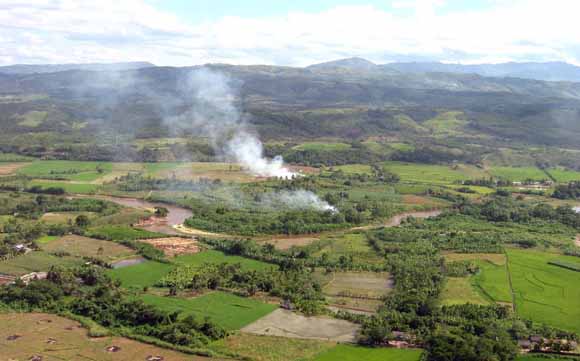
Land cover change detection analysis in and around Cordillera Azul National Park, Peru
The first product of the Optimizing Design and Management of Protected Areas for Conservation Project is a land cover change detection analysis based on Landsat thematic mapper (TM) and enhanced thematic mapper plus (ETM+) imagery collected at intervals between 1989 and 2002. The goal of this analysis was to...
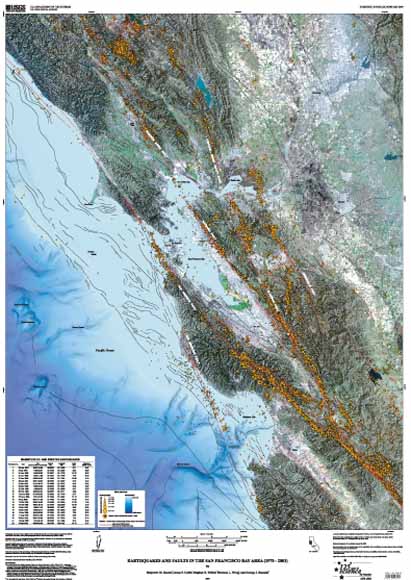
Faults and Faulting in the San Francisco Bay Area
The map depicts both active and inactive faults and earthquakes magnitude 1.5 to 7.0 in the greater San Francisco Bay area. Twenty-two earthquakes magnitude 5.0 and greater are indicated on the map and listed chronologically in an accompanying table. The data are compiled from records from 1970-2003. The bathymetry...


